Kerridge Commercial Systems boasts various business solutions that can assist in the development of an ERP strategy and, in turn, provide businesses with a high-quality ERP solution, enabling business decision makers with total control and allows for complete visibility over their business. We’ve built this software to support the way you view and run your business. For this purpose we created K8 Business Intelligence. Here’s how you can use this tool to optimally measure and evaluate your business:
The Key Performance Indicator reporting tools are designed to present performance against objectives for any branch or trading area, at any financial level, from the broadest sweep to the finest detail. You define access permissions to the Director, Finance and Manager Dashboards, which give different levels of information to your people, on the basis of what they need to know to make decisions.
So, whether it’s a board-level review of operations across the organisation, an accountant’s eye view of actual versus budget figures, or a manager’s update on sales, stock levels or supplier positions, the picture is clear. Whatever the individual user’s preference, you can switch formats between tables and reports or smart graphical interpretations.
There’s no better way to make sure you have the facts, accurate and up-to-the-minute before you evaluate the situation, consider the options and commit resources to action. So you know you are making intelligent decisions, based on sound business intelligence.
Manager Dashboard
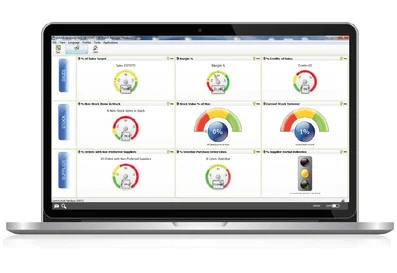
Designed and structured to suit managers across the business, the Manager Dashboard is perfect for department, branch, area or regional managers, tailored according to their specific requirements and permissions. The presentations enable performance and comparisons to be made for fast and effective decision-making about sales, stock levels and supplier positions.

- Sales and margins versus target, in total and for each product grouping
- Customer Credits issued as a percentage of sales
- Stock on hand expressed as a percentage of the maximum stock
- Non-stock items in stock, expressed as a percentage of overall stock
- Stock turnover and predicted weeks cover
Finance Dashboard
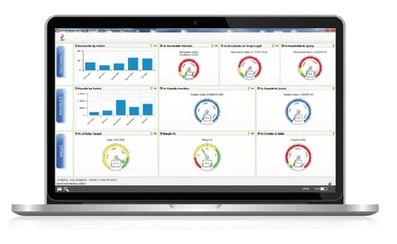
Senior finance managers are offered high levels of control, data access and analytical capability. The Company Performance view presents at-a-glance comparisons of actual v. budget in areas such as sales, margin and cash flow. In the Debtors' view, clear information about the accounts receivable position is presented, including cash collected and credit notes issued.

- Receivables by period
- Overdue debt and the value of debt attributable to customers on stop
- Total of invoices under query
- Payables by period and overdue
- Sales and margins versus target
Director Dashboard
Directors and senior managers are presented with a holistic view of the business across multiple departments and can drill down to the required level of detail. This dashboard provides a top-level overview of operations and is easily switched to display sales, margin data, refund/credit information and warehouse stock positions.

- Sales and Margins versus targets
- Outstanding orderbook position
- Value of invoices awaiting margin review
- Value of outstanding picks
- Stock valuation and non-stock items in stock
Whatever your aims are for the year ahead, Kerridge Commercial Systems' ERP software helps drive efficiencies, streamline processes and ultimately enables you to get more from your business. For more information, contact us today or request a demo.